Monitor all your domains in one view. Latency, status codes, page size — every 10 minutes, no config required.
Login with GitHub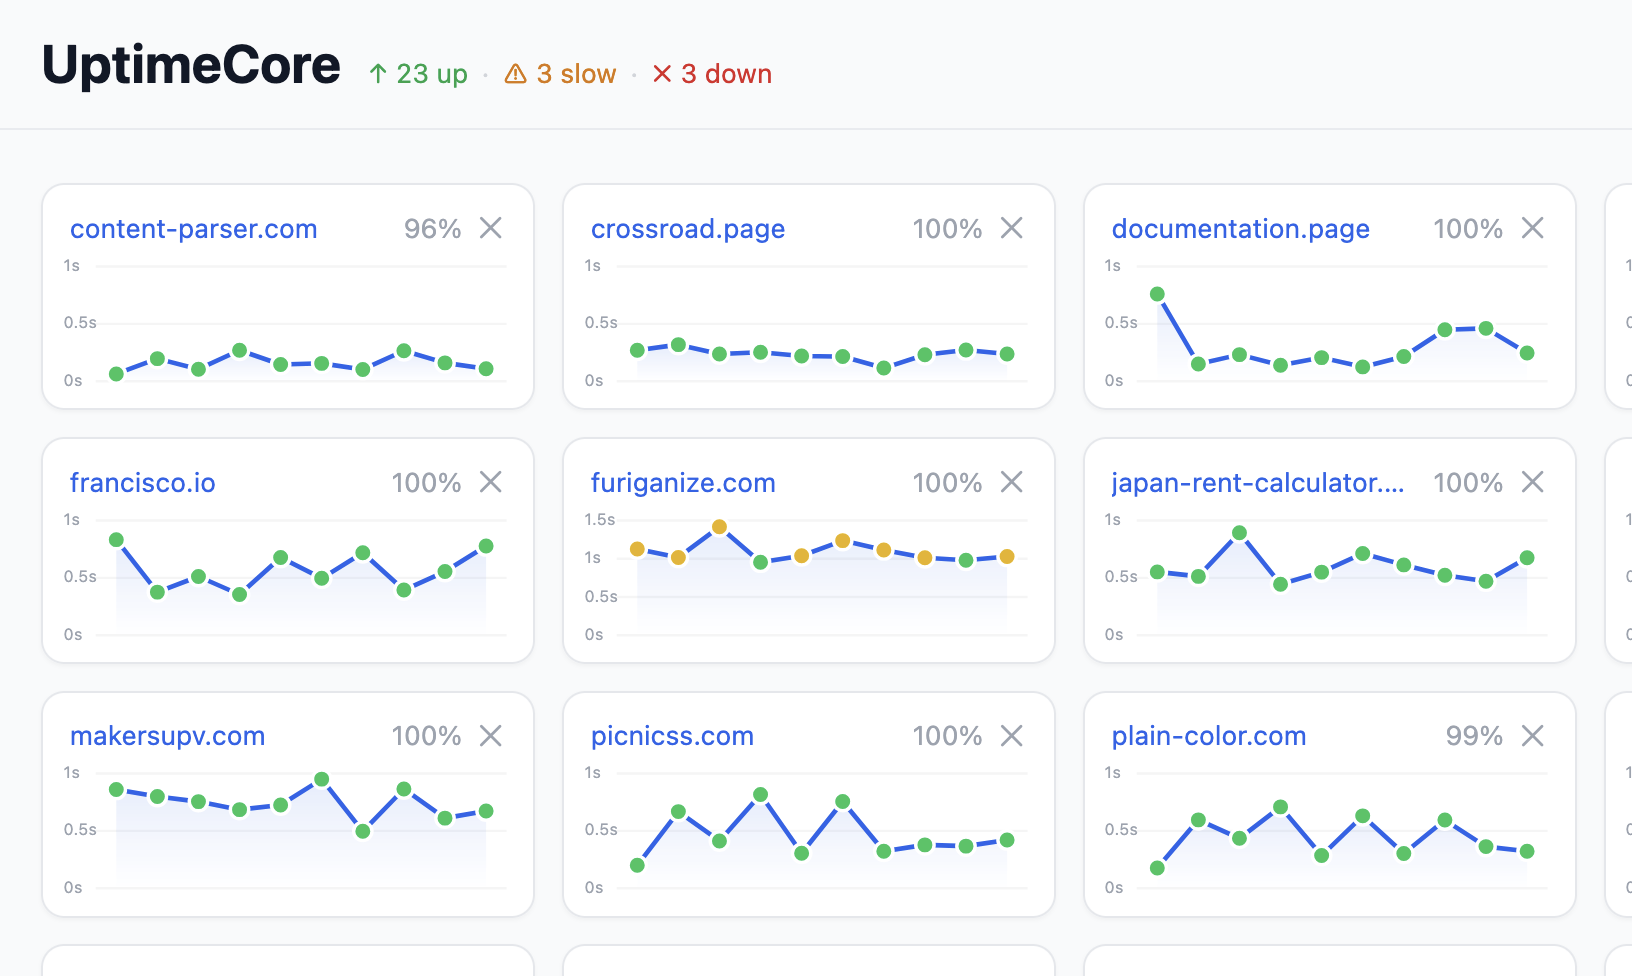
Dense grid layout — monitor 40+ sites on a single screen. Add as many domains as you want, just paste a URL.
120 minutes of response time history per domain. Spot degradation before it becomes an outage.
Every check records the HTTP status code and response size. Catch redirects, regressions, and bloat instantly.
Checks run every 10 minutes, aligned to the clock. Green, yellow, or red — no reading required.