 UptimeCoreUptimeCore
Screenshots, health checks and uptime for all your domains in one grid. Checked every 10 minutes, no config required.
Login with GitHub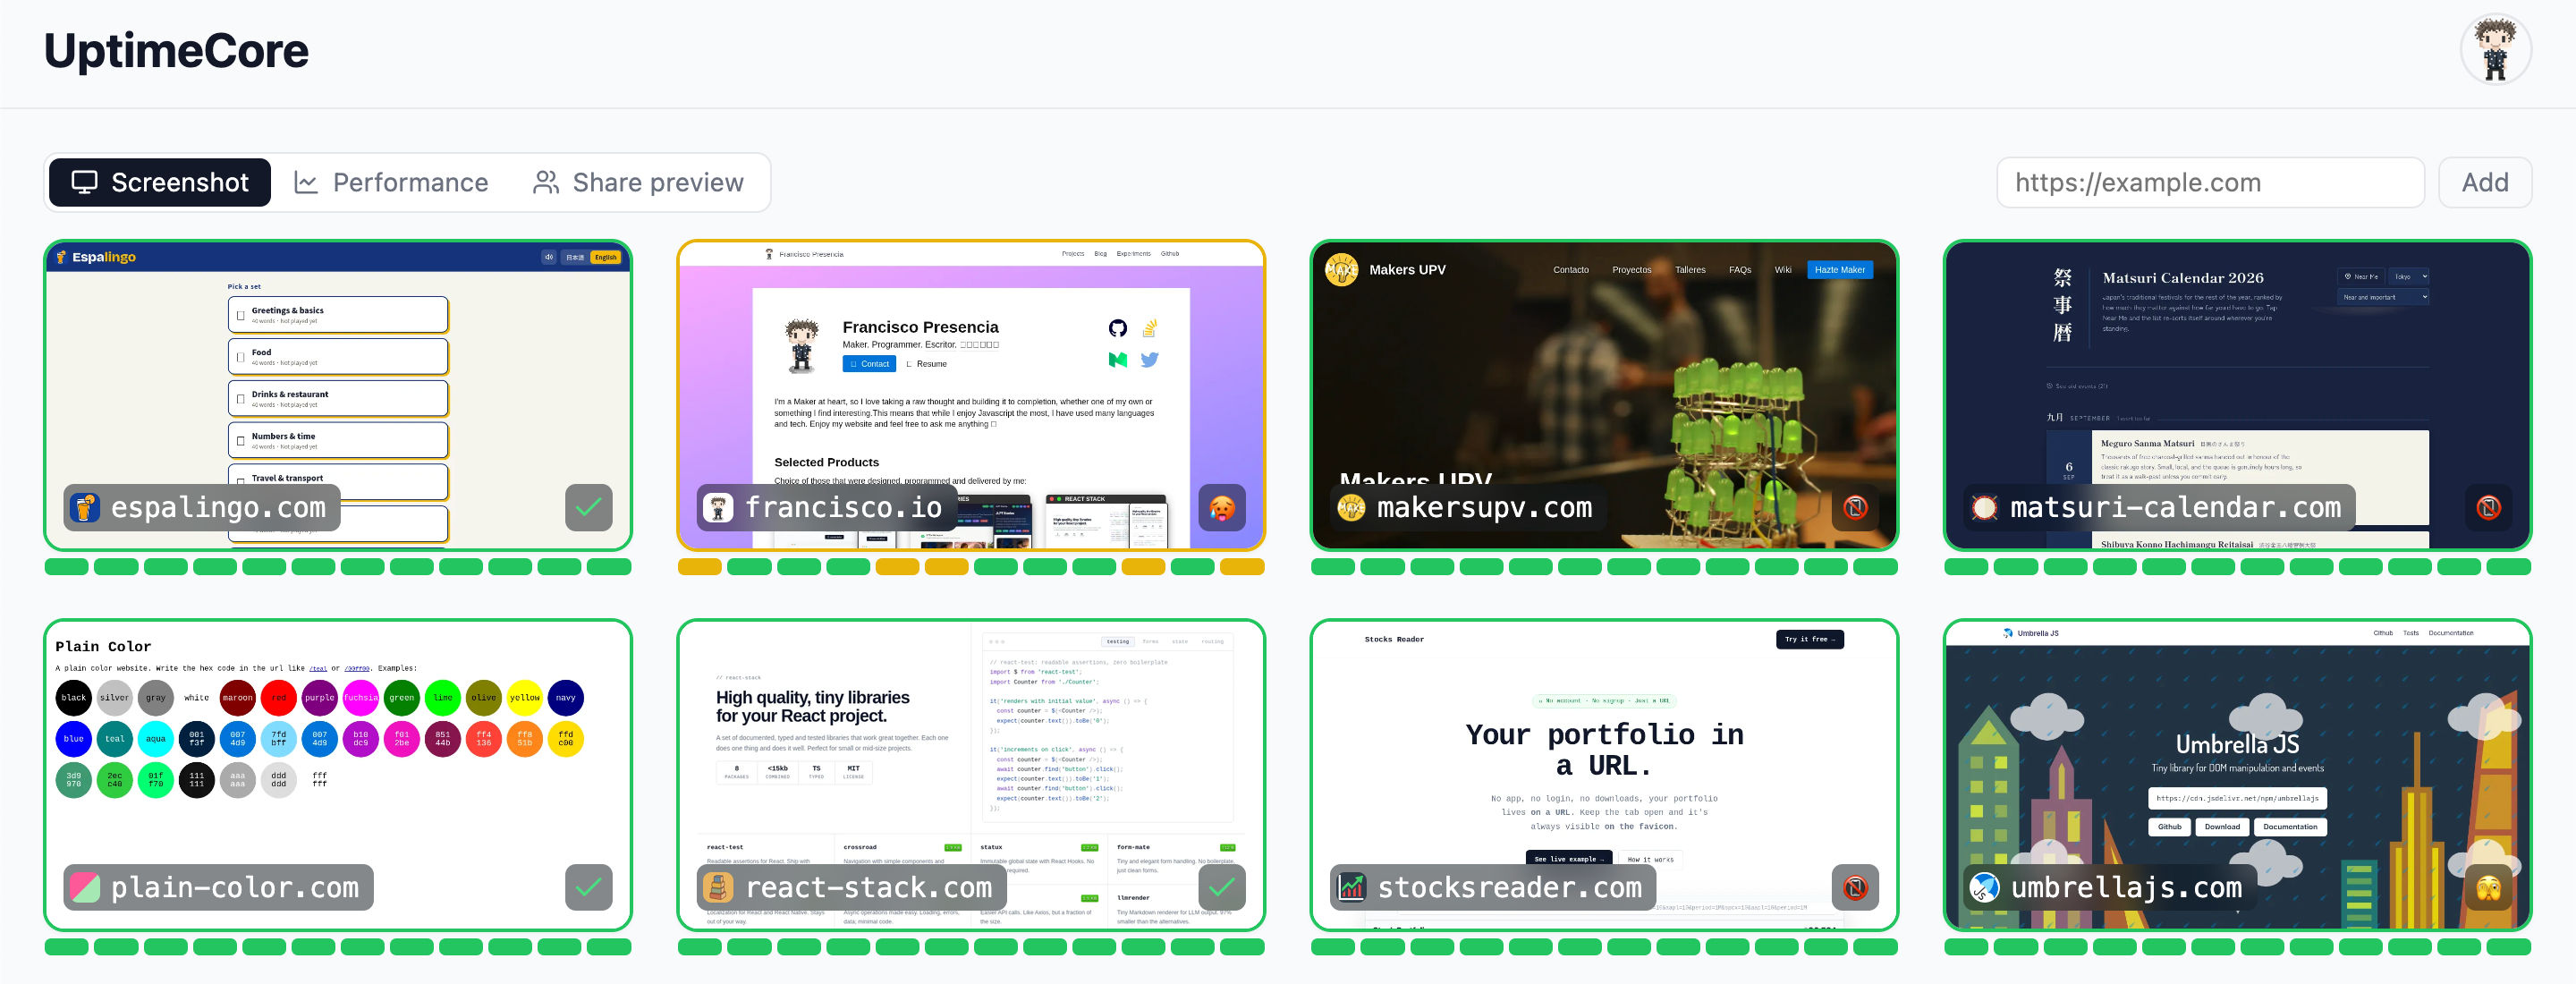
A desktop and a mobile capture of every domain, refreshed daily. A probe says 200; a screenshot says the deploy went out with the staging banner still on it.
Every domain gets a checklist: page weight and largest paint measured in a real browser, not guessed from the HTML. The card carries the verdict, so a problem is visible from the grid without opening anything.
The share preview for each domain, built from its own tags. Catch a missing og:image, a truncated title or a stale description before you post the link, not after.
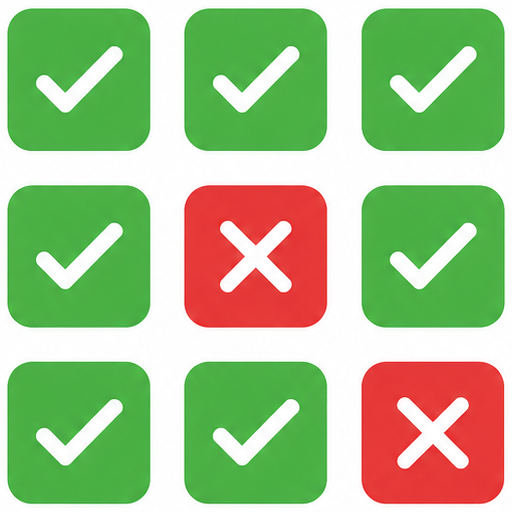
The favicon is a grid of your sites, redrawn as they are checked. Pin the tab and it is an always-on status light: a square turns amber when a site slows down, red when it stops answering. No alert rules, no second app to install.
Sign in with GitHub, paste a domain, and the first check runs immediately.
Login with GitHub